• Home
    • Main Page
    • News
  • Products
    • Nittoseiko Analytech (d/h Mitsubishi Analytech)
      • The All New CA-310
      • The All New GT-310
      • Moisture Meter CA31
      • Moisture Meter KF31
      • Moisture Meter Vaporizer VA-200
      • Moisture Meter Vaporizer VA-210
      • Moisture Meter Vaporizer VA-236S
      • Automatic Titrator GT-200
      • Autosampler for GT200
      • NSX-2100V
      • NSX-2100H
      • CRI-210V
      • GI-240
      • Total Organic Halogen Analyzer TOX-300
      • AQF-2100
      • Aquamicron
      • Karl Fischer Moisture Meter
      • AOX-200
      • Total Organic Carbon TOC-300V
      • Resistivity Meter
      • Loresta GX MCP-T700
      • Loresta AX MCP-T370
      • Hiresta UX MCP-HT800
      • Powder Resistivity MCP-PD51
    • Toki Sangyo
      • TVC-7
      • TVB-10W
      • TVB-15
      • R-85
    • Chromatec
      • Crystal 9000
      • Crystal GCMS
      • Software
    • EMC Lab
      • EMC-11D-V
      • EMC-16/18 series UV/VIS
      • EMC Nano UV
      • EMC 11 UV
      • EMC 3PC series UV
      • EMC 6PC Series UV
    • Insent
    • JS Research
  • Products 2
    • Thermo Scientific
      • Immersion Circulators
      • Refrigerated/Heated Bath Circulators
    • Sicco
      • Drying Cabinet
    • Freund Water Activity
      • Freund EZ-200
      • Freund EZ-100ST
  • About Us
    • Services
      • People Development
      • Calibration
  • Contact
    • CAREER
  • Pojok HILABSCI
  • Events
  • Gallery Training and Seminar
  • Gallery Instrument

Webinar: 3D Dynamic Image Analysis Compared to Other Methods to Identify Crystal Shape

11 Jun, 2019

PartAn 3D Instrument used for image analysis

In this webinar we will present data from research conducted at University of Hohenheim on crystal samples of Sodium Chloride, Mono Sodium Glutamate (MSG) and Sugar. These crystals all exhibit particle shapes which diverge from spherical shape by different degrees. These different particle shapes, as well as sizes, can be measured and quantified on the same instrument – a dynamic image analyzer. Those measurements were compared with measurements made on other instruments – a stand-alone laser diffraction analyzer, a simple scanner reporting size and shape, and a manual microscope and SEM. We’ll show how the image analyzer provides data that agree closely with sizes and shapes measured on the other three instruments, in all three orthogonal dimensions and on a much larger and representative sample of particles. Particle shape is becoming an ever more used measurement technology in characterizing particulate samples, because size alone is recognized to often not provide distinguishing differences among samples.

Join us in learning more about Image Analysis and how it has become the most common technology for measuring particle morphology. Special guest, Patrick Wilms from the University of Hohenheim will talk about his experience using Microtrac’s Microtrac PartAn 3D and the advantages of imagining technology.

This webinar is scheduled for Thu, Jun 20, 2019 11:00 AM – 12:00 PM EDT.

Register Here

Unable to attend? Register to receive the webinar recording!

Webinar: Hybrid Technology For Complete Metal Powder Morphological Characterization

12 May, 2019, No comments

Metal powder sample with Sync FlowSyncMicrotrac’s Sync uses an innovative hybrid method of particle size and shape measurement that combines laser diffraction and image analysis. Metal Powders require high flowability and packing density for even, fast loading and high strength in final parts. Key parameters to spec are Sphericity, Smoothness, and Size Distribution. These properties are important for outgoing QC for Metal Powder manufacturers and incoming QC for Powder Metalllurgy parts manufacturers. This presentation describes the QC requirements and a combination analytical instrument which measures them.

Join us for this webinar as we cover:

  • How Microtrac integrated laser diffraction and dynamic image analysis technology in one instrument
  • Metal Powder Parts Manufacturing Methods
  • Importance of Powder Morphology
  • Quality Control for Metal Powders

Join us for this free webinar on Thursday, May 30th, 2019.

Can’t attend? Sign up to get the recording!

Register Here

Webinar: Introducing the Microtrac Sync: Hybrid Laser Diffraction and Dynamic Image Particle Analyzer

18 Sep, 2018

Microtrac Sync, laser diffraction and image analysis instrumentWith over 25 years at the forefront of technological advances in measuring material size and shape in real-time, Microtrac is the established leader in delivering innovative analysis solutions.

Microtrac is proud to announce our new synchronous size and shape analyzer, Sync, which integrates the world’s leading laser diffractiontechnology with the world’s leading dynamic image analysis technology – Same bench, same sample, same run, same flow cell, same user interface. Users can now get their tried and true particle size distribution together with particle morphology in a single, easy to use graphical user interface.

Using our patented methodology, the Sync interrogates particles, wet or dry, with laser light while simultaneously a high-speed digital camera takes images. The data collected is processed by our FLEX software and presents the user with particle size and shape information. While the software is powerful, the graphical user interface is intuitive and easy to use. The Sync enables users to get more detailed information about their material than ever before and will quickly render size-only instrumentation outdated and incomplete.

Please join us for an in depth webinar on the features and capabilities of the Sync. Let us share with you how Microtrac is changing the paradigm for material characterization.

Join us on Thursday, September 20, 2018 at 11AM EDT


Click Here to Register


Unable to attend? Register to receive the recording!

Webinar: Metal Powders Quality & Process Control Based On Powder Morphology

8 Oct, 2017

Direct Reduced Metal PowderMorphological properties, which include size and shape, are important quality control specification parameters for metal powders. These properties are important for outgoing QC for Metal Powder manufacturers and incoming QC for Powder Metalllurgy parts manufacturers. This presentation describes the QC requirements and a combination analytical instrument which measures them.

Join us for this webinar as we cover:

  • Metal Powders Processes
  • Metal Powder Parts Manufacturing Methods
  • Importance of Powder Morphology
  • Quality Control for Metal Powders

This free webinar, Metal Powders Quality & Process Control Based On Powder Morphology airs on Thursday, October 19, 2017.

If you’re unable to attend, we welcome you to sign up to get the free recording.


Click here to register

Identifying good, bad, and ugly particles with dynamic image analysis

4 Aug, 2017

Published on Jul 27, 2016

Learn how you can identify good, bad, and ugly particles with advanced data analysis capability featured in Microtrac's Imaging technology. This webinar will explain the following; how to identify contaminants during production/handling/packaging, impact of too high/low aspect ratio, surface roughness, sphericity, or transparency has on final product quality, seeing is believing - view particles, search capability - display results based on user defined conditions, benefits of comparing morphological parameters, and graph manipulation. Dynamic Image Analysis is ideal for measuring the size and shape of materials from several microns to several millimeters.

Read more...

Determination of chlorine and sulfur in 3,5-dichloro-2-hydroxybenzenesulforic acid sodium salt

3 Aug, 2017
Instruments : AQF-100

Method : Combustion-ion Chromatography

Related standard :

Concentrations of fluorine, chlorine, bromine, iodine, and sulfur can be determined and accurately by using a combustion ion chromatography (CIC) system combining an Automatic Quick Furnace Model AQF-100 which safely combust samples with an ion chromatograph.

Read more...

Using Image Analysis to Replace Sieves

3 Aug, 2017

If you’re still using sieve analysis for your particle analysis needs, you may be faced with frequent measurement errors such as failing to collect the complete set of particles from each sieve, mis-weighing, incorrect data entry or calculation errors with distribution percent values. Not to mention this method can be frustratingly slow and labor-intensive. Image analysis gets you past these hurdles with minimal effort. 


In this webinar you'll learn about making the transition to image analysis from sieving! 

Microtrac, Inc. is a particle characterization instrumentation company dedicated to particle science and customer satisfaction. Microtrac released the first commercially available particle size analyzer using laser diffraction. We have over 40 years particle characterization experience and technology.

Click here to go to the webminar...

Published on Jun 1, 2017

Measuring Electric Power Generation By-Products

2 Aug, 2017, No comments


Quality Control of Power Generation Plant By-Products

Coal represents a major contributor to the production of electric power. The large amount of coal used for power generation produces by-products that are deemed deleterious: sulfur dioxide, nitrogen oxides, particulate and carbon dioxide. This presentation outlines some of the advances and positive actions taken by the electric power companies to comply with these acts by using by-products of coal burning for electric power.

Join us on July 27th as we go over:

Typical Microtrac particle size distribution for fly-ash.

  • Coal power generation pollutants
  • Pollution abatement processes
  • By-products produced from pollutants
  • Particle characterization for quality of by-products
  • Particle characterization technologies

This free webinar, Measuring Electric Power Generation By-Products aired on on Thursday, July 27, 2017.

3D Image Analysis : Know Your Materials

1 Aug, 2017, No comments


Would you like to collect 3D particle size and shape data of your materials ranging in size from 35um to 35,000um? If you have a need to identify and quantify different particulate components in one sample, this webinar will show you how. This can be easily accomplished with patented 3D image analysis and use of the search query and filter/classification features in the software.

Find out what advantages there are with 3D image analysis technology and go over its important advantages over 2D technology.

Go in-depth with Microtrac’s powerful, patented 3D measurement software. The reporting is simple, powerful and flexible. Learn more in our webinar!

Speaker: Terry Stauffer
Terry Stauffer has over 40 years of particle characterization experience. He has worked for all the major players in the particle analysis industry at some point in his career. He will be answering all your image analysis questions at the end of the webinar!

This free webinar, 3D Image Analysis: Know Your Materials aired on Thursday, March 30, 2017

Use of Electric Power Generation By-Products in Wallboard, Cement and Plastics

31 Jul, 2017

Coal represents a major contributor to the production of electric power. It also provides coke for production of steel, gasified coal for production of carbon monoxide and hydrogen to produce Tylenol and NutraSweet, and coal tar for light oils and ammonia. The large amount of coal used for power generation produces byproducts that are deemed deleterious: sulfur dioxide contributes to production of acid rain; nitrogen oxides contribute to acid rain, ozone, and smog; particulates contribute to production of smog; CO2 is believed by some scientists to contribute to global warming. The Clean Air Act of 1970 advanced a beginning to reduce the quantities of these substances emitted to the environment. Subsequent acts placed further requirements to reduce environmental exposure to acid rain (1990) or to adopt Clean-Coal Technology (2005). This paper provides a short outline of some of the advances and positive actions taken by the electric power companies to comply with these acts by using by-products of coal burning for electric power... 

Read more...

New infrared method of identification of natural milk

28 Jul, 2017


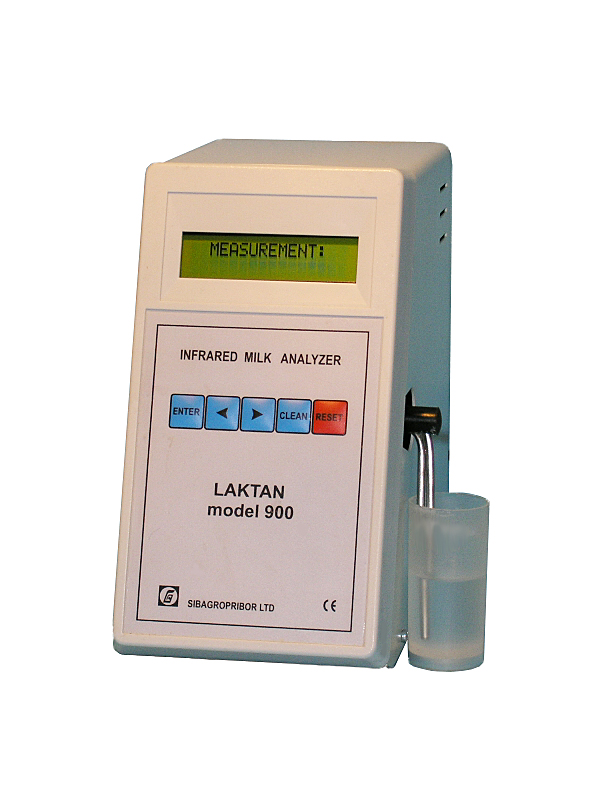
Taking into consideration keen interest to our new product (Laktan 900 Superfast IR milk analyzer) and growing market need for practical application of the Infrared method/ technology we would like to update our customers and partners on the results achieved at the current stage of our project. At present we are completing testing of the latest improved version of Laktan 900 after modification which takes into account the requirements of the Indian market. Simultaneously with this work we are preparing for launching of serial/ mass production of this model for execution of the bulk orders on hand.

l900_0.jpg

Besides we wish to inform our foreign colleagues that currently research work for development and approval of this method (Optical Method of Identification of Natural Milk) is carried out at the All-Russian Research Institute of Optical and Physical Measurements (VNIIOFI), Moscow, one of the oldest and the most reputed Scientific and Research Institutes in this field in Russia.

According to the information published on the official web-site of Rosstandart (Federal Agency for Technical Regulating and Metrology of Russian Federation) November 6th, 2014 the new method of identification of natural milk was presented by research scientists of the All-Russian Scientific Institute of Optical and Physical Measurements to the Assistant Chairman of the Russian Federation Government Mr. Gennady Onischenko and the Head of Rosstandart (Federal Agency for Technical Regulating and Metrology) Mr. Alexey Abramov.

Preliminary research work (incl. analysis of various types of milk) has been conducted at the laboratory of optical spectral instruments of the All-Russian Scientific Institute of Optical and Physical Measurements. 
Uniqueness of the method developed at the All-Russian Scientific Institute of Optical and Physical Measurements is that milk quality is determined by means of optical measurement of distribution/ dispensing of micron and nanoscale particles in milk. 
Having acquainted himself with the results Mr. Gennady Onischenko pointed out that it necessary for the team of the Institute to continue this work; he also emphasized importance of the elaborating of the instrument base for practical application of the given method.

As of today there is a clear understanding of importance and urgency of this direction for Dairy Industry at all levels in Russia, and the state budget funds are allocated for implementation of this scientific project.There is no doubt that the given theme and scientific problem (development of the optical/infrared method of milk analysis) as well as development of a new affordable for the mass market IR milk analyzer for practical application of the given method are extremely complicated scientific problems, at the same time these are very important and urgent tasks, and Sibagropribor has already made a significant contribution on implementation of this task.

Advantages of the Frequency Power Spectrum Method

24 Jul, 2017, No comments

If you’re using dynamic light scattering (DLS) for the measurement of your nano-particles, you may be familiar with the photon correlation spectroscopy (PCS) method. Although PCS is a widely used DLS method of measurement, there is a superior method.


Microtrac’s proprietary approach to DLS, the frequency power spectrum method (FPS), overcomes the limitations of PCS. Heterodyne FPS gathers data in higher resolution than PCS. Having the detector set to 180° allows to measure in higher concentrations, and to even go on-line. The Microtrac FPS method effectively allows to accurately measure from sub-nanometer to several microns across the widest concentration range on the market.

Join us as we go in depth on dynamic light scattering and discuss topics such as:

Frequency Power Spectrum
Photon Correlation Spectroscopy
Reference Beating
Heterodyne Detection vs Homodyne Detection
and more!

Joining us for this webinar is special guest, Brian Freeland from Dublin City University. He will present comparison data and talk about his experience using Microtrac’s Nanotrac Flex.

This free webinar, Advantages of the Frequency Power Spectrum Method aired on Thursday, June 22, 2017.

Particle Size Analyzer Demo Day Part 2

9 May, 2017, No comments


Penelitian di bidang nanoteknologi membutuhkan banyak instrumen penelitian untuk mengetahui unsur-unsur yang terdapat di suatu material penelitian. Mulai dari scanning electron microscope (SEM), x-ray difrraction (XRD), particle size analyzer (PSA) , atomic force micsroscope (AFM) dan lain sebagainya.

Penguasaan beberapa alat di atas sangat penting untuk menunjang kinerja penelitian. Atas dasar itulah pada hari Senin, 8 Mei 2017 bertempat di gedung Indonesia Life Science Center- PUSPIPTEK, Masyarakat Nano Indonesia (MNI) menggandeng salah satu supplier alat di bidang nanoteknologi PT. HILAB Sciencetama, untuk melakukan demo penggunaan alat PSA. PSA sendiri digunakan untuk mengetahui ukuran partikel dan berat molekul. Sampel yang digunakan biasanya berbentuk cair.

Acara dibuka oleh Dr. Setyo Purwanto selaku pengurus dari MNI, kemudian dilanjutkan oleh Bapak Eddy selaku perwakilan dari PT HILAB Sciencetama dalam menjelaskan dan demo alat. Peserta yang hadir dalam acara kemarin adalah member dari Masyarakat Nano Indonesia yang terdiri dari peneliti , dosen dan mahasiswa. Tiap peserta yang hadir berkesempatan dalam menguji sampel yang telah dibawa untuk dilakukan preparasi, uji pengukuran, dan pembacaan hasil pengukuran sampel. Harapan dari acara ini adalah para peserta yang datang dapat mengetahui langkah dasar dalam pengoperasian alat PSA dan MNI akan selalu memberikan dukungan terutama unutk kegiatan yang bertemakan nanoteknologi.

Particle Size Analyzer Demo Day

9 May, 2017, No comments


Masyarakat Nano Indonesia bekerjasama dengan PT. Hi-Lab  Sciencetama (Suplier Alat Laboratorium Nanoteknologi Terpercaya di Indonesia) mempersembahkan  event yang bertema “PSA Demo Day”.

Kegiatan ini adalah bagian dari acara pre-workshop PSA (Particle Size Analyzer) yang akan diselenggarakan bulan depan dan gratis pengujian sampel yang terpilih.


Kegiatan ini akan dilaksanakan pada :

Tanggal : Senin, 8 Mei 2017

Waktu :  10.00 – 12.00

Tempat: Gedung ILSC (Laboratorium PT. Nanotech Herbal Indonesia)

Jalan Raya Puspiptek, Kawasan TBIC Ristek Gunung Sindur, Bogor

Invited expert: Prof. Ratno Nuryadi (Ketua Umum MNI)

Dan Tim Ahli HiLab


Acara ini GRATIS  khusus untuk MEMBER MNI, dan kouta terbatas.


Konfirmasi kedatangan, pengujian sampel dan aktivasi Member MNI dapat menghubungi

Iwan 0857 7266 4746


Informasi seputar nanoteknologi

Fanpage FB: Indonesian Society for Nanotechnology

Twitter :@nano_indonesia

Web : nano.or.id

Email : [email protected]

Recent Posts

  • 7 alasan titrasi otomatis lebih baik dibanding titrasi manual
    18 Jan, 2022
  • Mengenal Jenis Sample Viscometer
    28 Apr, 2021
  • Manfaat Kalibrasi yang Harus Kamu Tau
    21 Apr, 2021
  • Manfaat Sinar Matahari Pagi yang perlu kamu tahu...
    20 Jan, 2021
  • What is Potentiometric Titration ? Apa itu Titrasi Potensiometri ?
    18 Jan, 2020
  • Mengenal Kecerdasan Majemuk Manusia
    4 Dec, 2019
  • Perpanjangan SIM (Surat Izin Mengemudi) di Gerai SIM Mal Artha Gading
    15 Oct, 2019
(C) 2018 - 2023 HILAB SCIENCETAMA